As an eCommerce business, you want to be able to make data-driven decisions. Be it introducing a new product range or setting up a fresh marketing campaign, you need to be doubly sure about what you’re doing.
Considering the ever-increasing number of brands online, it is understandable.
But while you’re spending hours on analytics, are you really tracking the right numbers?
Let’s take one metric for example – social media followers.
You have 205k followers on Instagram. Each of your posts has been getting steady 1.5k likes. So you dig into insights to see which hashtags worked and what the overall reach of the post was.
But here are two questions:
- Are all of those 205k followers your customers?
- Did the 1.5k users who liked your post visit your store or make a purchase on the same day?
Unless you used some magic, the answer is NO.
That’s why there are some metrics that we call ‘vanity’. And some that actually help you grow your eCommerce business.
eCommerce metrics to measure growth
Every brand has different market goals. But if you have an online store, here are the metrics that should be included in your growth report.
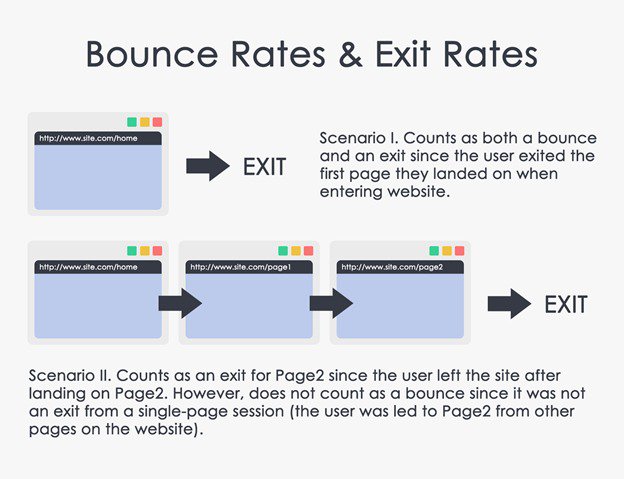
Bounce rate (BR)
Don’t just measure the number of shoppers visiting your store. Measure the percentage of visitors who landed on one page and exited without even viewing any of the other pages. The bounce rate shows how engaged a shopper was when he reaches your store, and how well (or not) your site was able to retain their interest.
The lower the bounce rate, the more engaged the shopper is with your brand.
Exit rate (ER)
While most focus only on the bounce rate, it is also important to identify the problem areas on your site. That’s why you should be measuring the exit rate. It refers to the percentage of people who left your site from a specific page.
Now this page could be the first one they land on or reached using navigation or search.
A high exit rate indicates that shoppers are dropping off from that page. It could be because they didn’t find what they were looking for or even worse, your page was broken or not found.
Pages per session (PPS)
There will be shoppers who land on a specific product page and then leave. But there will also be those who would visit some other pages to see what you offer. Pages per session refer to the average number of pages a shopper visits. It indicates how engaged they are with your brand and what you offer.
The more the pages, the higher are the chances of conversion.
Average session duration
Your shoppers could be visiting ten pages on an average per session. But if they’re just browsing through different pages without consuming more information about a product, they are less likely to convert. The average session duration refers to the time a shopper spends on your site.
The longer the session, the more engaged they are with your brand.
Number of sessions per user
A typical shopper will never convert on their first visit. They are more likely to first explore all the options in the market and the discounts they can avail before making a purchase. The number of sessions per user indicates how many visits it took them to finally turn into a customer.
Under this metric, you can examine conversions, revenue, and shopper behavior closely.
Average session duration
The average session duration is the result of the total duration of all the sessions divided by the number of sessions. The average session duration measures how long a shopper is interacting with your online store’s pages before exiting. It is calculated by dividing the total duration of all sessions by the number of sessions.
Simply put, here too, you’re targeting a higher average session duration.
Time lag
Online shoppers don’t make a purchase on seeing the very first deal. That’s why it is important to measure the time lag and understand the shopper’s journey. It refers to the number of days it takes for a shopper to turn into a customer, starting from the first time they make an interaction.
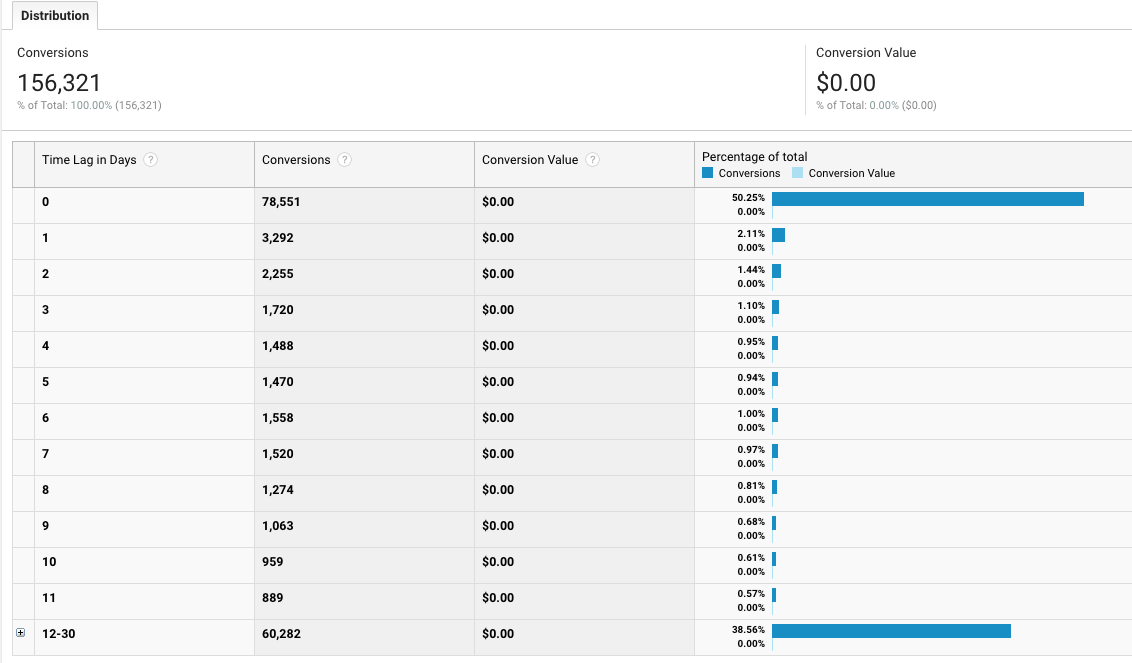
Chartio shared a complete guide on how you can measure and use time lag. Check it out here!
Conversion rate (CR)
The conversion rate is one of the most common metrics measured by eCommerce businesses. It refers to the percentage of shoppers on your online store that completed the desired goal (conversion) out of the total number of shoppers. The conversion could be subscribing to your newsletter, following you on social media or making a purchase before leaving.
What you’re targeting at here, is a high conversion rate.
Average order value (AOV)
This is another one of the most important metrics for an eCommerce business. It basically refers to tracking the average amount spent each time a shopper places an order on your site. The total revenue is then divided by the total number of orders to achieve the average order value.
Conversion by traffic source
While you’re monitoring the overall conversion rate, the average order value and the revenue per session, also focus on noting the traffic source. Measuring conversions by traffic source helps you understand which channel is working the best for your eCommerce goals.
Be it from the search engines, social media, affiliates or digital communities, the metric will help you optimize promotion budgets and your messaging.
Ps. Don’t forget to check what traffic your affiliates have been sending. They could be double charging you for sending back shoppers acquired through SEM channels.
Conversion by device type
Once you have identified your traffic sources, it is time to look into what devices these shoppers are using. Are the majority of your shoppers using mobile devices or desktop?
This metric will help you understand more about your shoppers and their purchase behavior. It further helps identify the opportunities that you should be focusing on more.
For instance, if you have more mobile shoppers, you can run social media ads for mobile devices only. This way you cut down on your spends for running desktop placed ads.
Revenue per session (RPS)
Revenue per session is a measure of the amount of money you generate every time a shopper comes to your store. It helps you estimate the value of each shopper-driven, helping optimize your SEM campaigns accordingly.
When you’re A/B testing changes on your eCommerce store, RPS is a more important metric than the CTR (click-through rate). But this is true when you have large volumes of transactions to add to the test, as RPS requires significantly more data to get statistical confidence.
Product page abandonment rate
A lot of your shoppers will land on the product pages you’ve been promoting. They might add the product to a wish list. Product page abandonment is when this shopper leaves your site from the product page itself – they don’t even make it to the cart.
A high product page abandonment rate indicates shoppers are not interested in what you offer.
But while you’re measuring product page abandonment, don’t forget to check if browser injected ads are taking away your shoppers.
Cart abandonment rate
We know this is something you’ve been measuring for a really long time. But for just a quick recap, cart abandonment rate is a measure of the number of times products were added to a cart by a shopper and then not purchased before exit.
The average cart abandonment rate across industries has gone higher than 69%. And we found the 3 most overlooked reasons for it. Read about them here!
Measuring the right eCommerce metrics
No matter what your eCommerce business is about. If you’re not measuring the right eCommerce metrics, you will never understand the different type of shoppers that come to your store.
And with no understanding of your shoppers, any optimization you do will not lead to results that have an actual impact on your growth.
So, which of the above eCommerce metrics did you miss measuring last week?